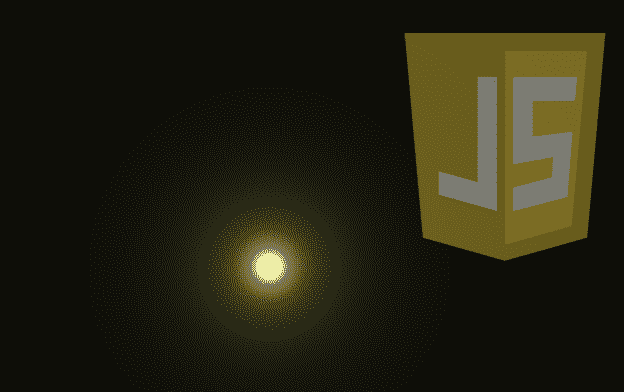
We explain how to create a light point with HTML, JavaScript and Canvas.
Continuing with the experiments with HTML, Canvas and JavaScript, today I bring you a small experiment that allows you to create a light point with JavaScript and Canvas.
Over time we have seen several experiments using JavaScript and Canvas, in addition to the immense amount of resources that exist on the Internet that use Canvas and JavaScript as fundamental technologies:
- EL SECRETO DE LAS ANIMACIONES EN JAVASCRIPT (REQUESTANIMATIONFRAME())
- ¿CÓMO CREAR UN EFECTO DE ONDA CON CANVAS Y JAVASCRIPT?
- DIBUJANDO FORMAS GEOMÉTRICAS CON CANVAS EN ANDROID
- ¿CÓMO OBTENER IMÁGENES EN ESCALA DE GRISES CON SOLO HTML5?
- ¿CÓMO OBTENER POR SEPARADO EL CANAL RGB DE UNA IMAGEN CON HTML5?
- RECORTES DE IMÁGENES CON HTML5 Y JQUERY
Creating a light point (JavaScript)
Without wasting time, I present to you all of the JavaScript that we will analyze little by little in the next section:
            var _w = 800;
            var _h = 400;
            var circle;

            var c = document.getElementById('canv');
            var $ = c.getContext('2d');
            $.fillRect(0, 0, c.width, c.height);

            var set = function () {
                circle = new Circle(100, 100, 15);
                point();
            }

            var point = function () {

                var id = $.getImageData(0, 0, _w, _h);
                var pxl = id.data;
                for (var x = 0; x < _w; x++) {
                    for (var y = 0; y < _h; y++) {
                        var dens = circle.dim / dist(x, y, circle.cx, circle.cy);
                        var idx = x * _w * 4 + y * 4;

                        pxl[idx] = dens * 70;
                        pxl[idx + 1] = (dens * 70);
                        pxl[idx + 2] = (dens * 70) * 0.55;
                        pxl[idx + 3] = 255;
                    }
                }
                $.putImageData(id, 0, 0);
            }
            var Circle = function (_x, _y, _dim) {
                this.cx = _x;
                this.cy = _y;
                this.dim = _dim;
            };

            var dist = function (x1, y1, x2, y2) {
                var x = x1 - x2;
                var y = y1 - y2;
                return Math.sqrt(x * x + y * y);
            }
            set();
As you can imagine, the HTML is extremely simple and consists of only one canvas element.
Parsing the JavaScript above
First we declare some variables, among them the one that allows access to the canvas element and its context to be able to manipulate it:
            var _w = 800;
            var _h = 400;
            var circle;

            var c = document.getElementById('canv');
            var $ = c.getContext('2d');
            $.fillRect(0, 0, c.width, c.height);
We also create a circle expression function which specifies the position (X and Y) and dimensions of the circle:
    var Circle = function (_x, _y, _dim) {
        this.cx = _x;
        this.cy = _y;
        this.dim = _dim;
    };
The expression function simply calculates the distance between two points:
    var dist = function (x1, y1, x2, y2) {
        var x = x1 - x2;
        var y = y1 - y2;
        return Math.sqrt(x * x + y * y);
    }
The central point
The point expression function is the central point or heart of our JavaScript experiment; This function is the one that paints on the canvas element and varies said color according to the distance that exists between each of the points (pixels) that make up our canvas or Canvas and the circle defined at the beginning of the JavaScript code, in this way we create a point bright:
var dens = circle.dim / dist(x, y, circle.cx, circle.cy);An interesting detail which is the "trick" of this experiment is that the closer the Canvas points are to the defined circle - initially the code - the smaller the distance will be (obviously -.-) and therefore the calculation of The distance between two points will be smaller and the division would give a larger value - a lighter color.
Regarding the calculation of distances in a circle, it would give points with the same or similar colors giving the desired effect:

Varying the color of the light point
Multiplications by constant values are used to vary the color, try different values and you will see color changes.
Calculating the position to paint
The calculation of the idx variable is to traverse a one-dimensional array based on the counters (x and y) of an array. This is because the getImageData function returns a one-dimensional array and not a matrix as we might expect.
It is multiplied by four because the RGBA channels must be added, which are 4 and are added to the total of the matrix; if you run the following command:
id.data.lengthYou will see that it returns -for our experiment- 1280000; That is, the length of the data is calculated as:
AC * LC * TRGBAWhere:
- AC = Canvas Width.
- LC = Canvas Length.
- TRGBA = RGBA channel size (4).
Which in our experiment is:
800 * 400 * 4 = 1280000Beeping the luminous point on the Canvas
Finally we paint the color calculated through the distance between two points for each RGBA channel:
    pxl[idx] = dens * 70;
    pxl[idx + 1] = (dens * 70);
    pxl[idx + 2] = (dens * 70) * 0.55;
    pxl[idx + 3] = 255;
And that's all; again I leave you the link of the original experiment: CodePen: Chronic Fusion.

Develop with Laravel, Django, Flask, CodeIgniter, HTML5, CSS3, MySQL, JavaScript, Vue, Android, iOS, Flutter
