Activate the developer console in Chrome (Debug) of a window in Electron.js
- Andrés Cruz

When developing our web applications, a tool that we always have at hand is the use of the browser's developer console to debug it. In Electron, we can also easily use it, for this, we have to activate it. in the BrowserWindow() object:
index.js
function createWindow(){
    let win = new BrowserWindow({
        width: 800,
        height:600,
        webPreferences:{
            nodeIntegration: true,
            contextIsolation: false
        }
    })
    win.loadFile("index.html")
    win.webContents.openDevTools()
}
index.html
<!DOCTYPE html>
<html lang="en">
<head>
   <meta charset="UTF-8">
   <meta http-equiv="X-UA-Compatible" content="IE=edge">
   <meta name="viewport" content="width=device-width, initial-scale=1.0">
   <title>Document</title>
</head>
<body>
   <h1>App Electron</h1>
</body>
</html>
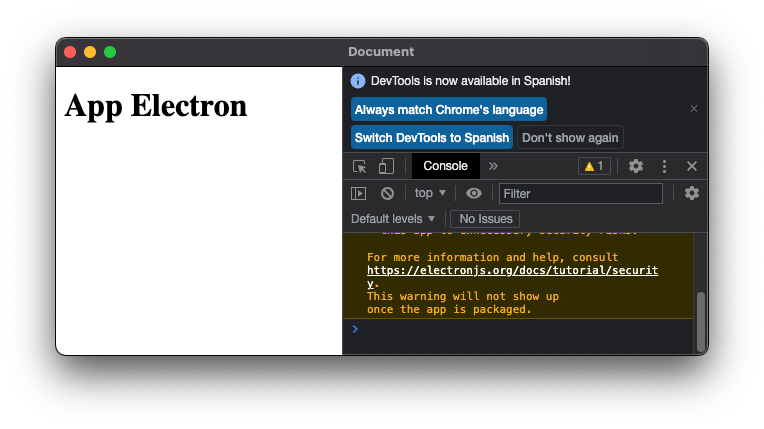
With this, any error that occurs in the rendering process or web page, we will see it in the console, so, when executing the application, we will have:
I agree to receive announcements of interest about this Blog.
We will know how to open the developer console in a window in Electron.
- Andrés Cruz

